

On Friday night, I posted about GamerGate, and my traffic spiked through the roof. Most of the traffic came from over 7,500 people who wanted to read that post. Thanks to Google Analytics, this gave me a reasonable geographic estimate of who
a) has some level of interest in GamerGate, and
b) saw a link to the post (most likely on Twitter).
To be clear, I have no way of knowing whether these visitors agreed or disagreed with my position, though I do know most retweets were from people who agreed. (Turning on comments might have given me some idea, but… it seemed like a bad plan.)
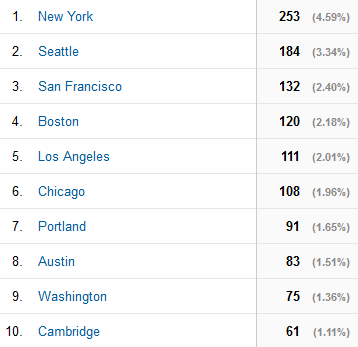
Not gonna clickbait you: there are no big surprises here. People mostly care about GamerGate in the US. Visitors came most often from NYC, followed by Seattle, San Francisco, and other big cities with game dev presence. The average mobile user showed up via Safari on iOS, and the average desktop user showed up via Chrome on Windows.
But I like web analytics, and maybe someone else will find this interesting, too.
On to the maps and graphs!
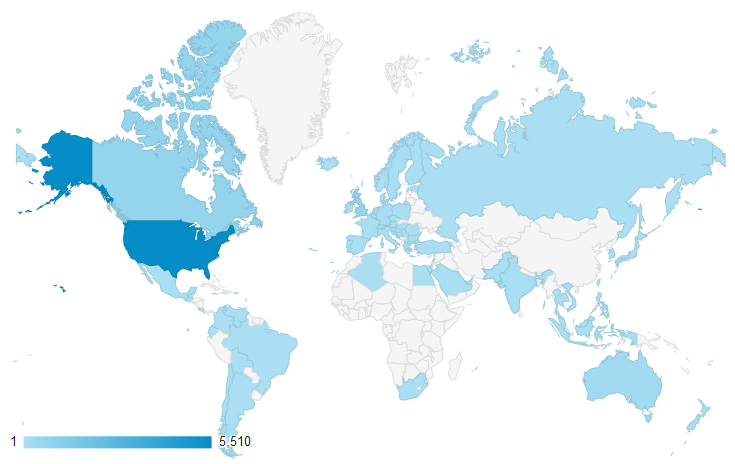
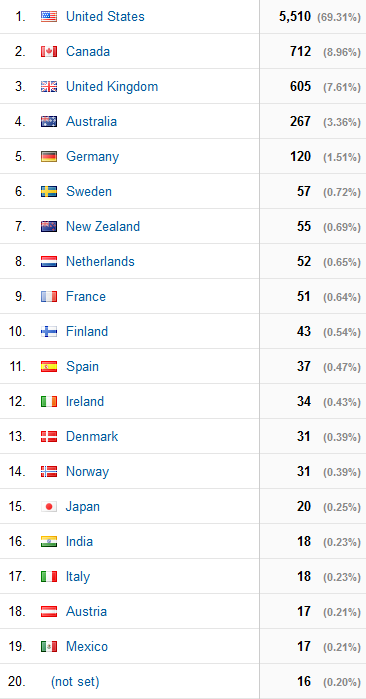
Almost 70% of visitors came from the United States, trailed by Canada (9%) and the United Kingdom (7.6%)
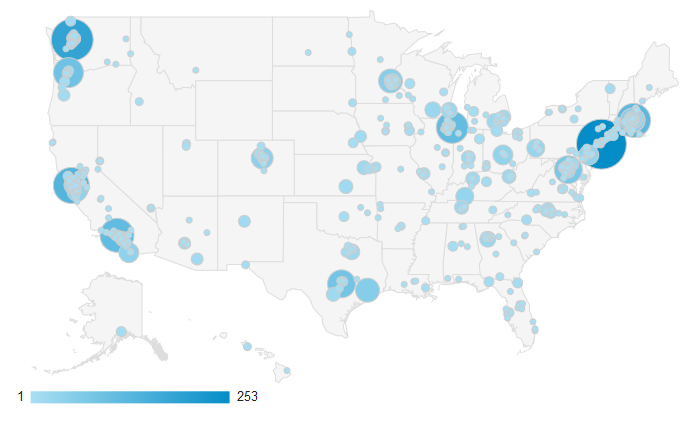
United States: visitors broken down by city
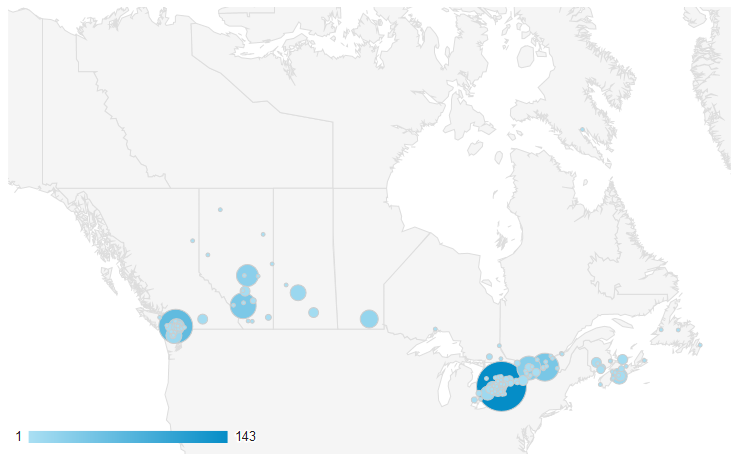
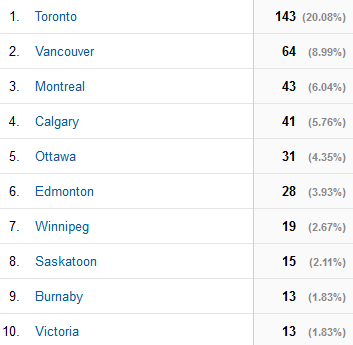
Canada: visitors broken down by city
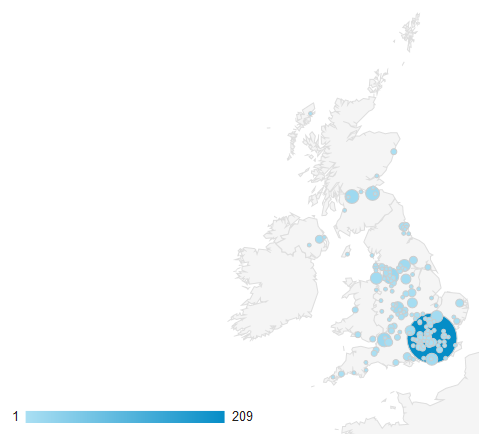
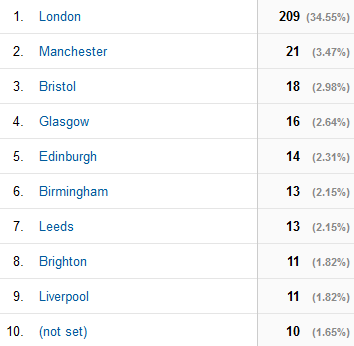
United Kingdom: visitors broken down by city
Most popular OS
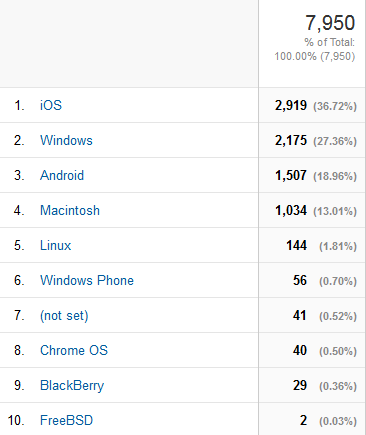
For the most part, the version breakdown across iOS wasn’t particularly interesting, but I did note that 70 visitors were running Windows Vista (upgrade!), and that Windows 8 is not as widely adopted as Microsoft wishes it were. Also, 24 visitors were on iOS 5.1.1, which probably means first-generation iPad, but might mean third-generation iPod Touch.
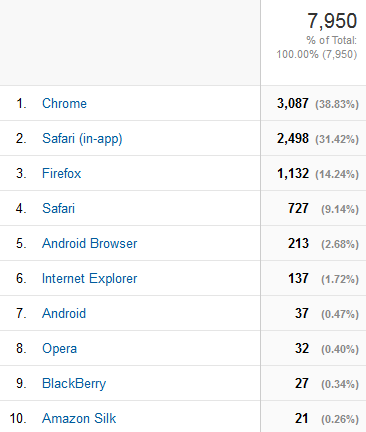
Most popular browser
I don’t have any of the Google Analytics demographics features active, so I don’t have any information about the age, gender, or other common interests of these visitors. If anyone else has demographic insight, I’d be interested to see it!
This is extremely interesting. I find it most interesting because I live in Australia and as you saw, it’s fourth on the list.
As far as I’m aware, there has been a bang up ZERO percent news coverage dedicated to this controversy. I also know that Australian gamers (this is generalizing but bare with it), do NOT tend to use game review sites (e.g. Kotaku Australia and other similar sites).
It’s interesting to see how different countries with different types of coverage and the ways the people of those countries get their information affect the sort of interest in specific topics.
Then again Aussies have never really given a damn about much, it’s all about sun, surf and sand over here!